Category Archives: Economy

You’ve been robbed!

The Left Business Observer (LBO) just put out another useful issue.  There is great deal there about the state of the economy, the fact that most of the increase in consumption is due to the increase in health care costs, the attempts to fix health care, and whether the economy really is deleveraging from the debt boom we have been in for over twenty years.  Full with lots of good details while a quick read and pretty inexpensive to boot.

One thing I want to call out is one of the end articles on the rich.  Thanks to Doug Henwood of LBO, I am able to provide you with two of the graphs in the article.  By the way, the source data for the charts below comes from the IRS by way of economists Emmanuel Saez and Thomas Piketty.  See my previous post The rich continue to get richer to find a link back some of their papers.

The first graph I will share is the share of income received, I won't say earned, from the early 1900s to 2007 by those in the bottom 90%, top 10%, top 1%, and top 0.1%.  Remember that the figures for the top 10% include those of the top 1% and 0.1% and those of the top 1% include those in the top 0.1%.

Income_shares

The graph speaks for itself, but for the post World War 2 period until the late 1970s/early 1980s, income for the bottom 90% was about 2/3.  During Reagan, and later, the wealthiest 10% claimed a greater share of the income produced in the US, to the point that they receive about 50%.  The dip in the end of the series is the 2000 recession.  Clearly eight years of Clinton didn't hinder the trend of the rich getting more.  One other thing to call out is that much of the change in the income share of the top 10% is due to increases in the top 1%.  This will become obvious below.

What is not shown is the shares for those in the bottom 50% or even 20%.  Based on other things I read, my guess is that those shares declined as well.

The next chart shows the percentage gains in income by group for the periods of 1948-1973 and 1982-2007.  Both are 25 year time periods and the first period reflects the post-World War 2 economy while the later represents the last 25 years (since the data set goes up to 2007.)

Income_gains

Clearly the bottom 90% saw a doubling of their income in 1948-1973, but a much smaller growth in 1982-2007.  Even the bottom 99% did better during 1948-1973 than in 1982-2007. 

Clearly, the big winners were those in the top 1%, especially the top 0.01% who saw their incomes quintuple during the 1982-2007 period.

So if you aren't in the top 1% and you are wondering where yours went, you know who got it.
A Cash for Clunkers Review

According to Toyota Tops List of Cash-for-Clunkers Winners (NY Times), 690,000 new vehicles were purchased with money from the Cash for Clunkers program.  On average, new cars got 25 miles per gallon (mpg) while "clunkers" got 16 mpg.  If the average person in the US drives 15,000 miles/year, then new cars will save 337.5 gallons of gas a year (937.5 gallons for "clunkers" and 600 gallons for the newer cars).

So did the Cash for Clunkers program pay off?  Lets try a back of the envelope calculation.

If we estimate that the "clunkers", without the program, would have been replaced within five years on average, then the total gas saved would be:

690,000 cars x 337.5 gallons saved per year x 5 years = 1,164,375,000 gallons saved

or about 1.16 billion gallons of gas saved.

Since about $2.9 billion was spent, that means that for every gallon saved, it cost the federal government about $2.49.  Increasing the average replacement time decreases the cost per gallon, while decreasing the replacement time raises the cost per gallon.

With gas costing $2.62 a gallon on 8/24 (see doe.gov), this is a slight savings.  The savings would grow should the price of gas go back to its high point of $4.00 in July 2008 or even higher when peak oil really kicks in.

Some (1 , 2) have estimated the true cost of a gallon of gas to be significantly higher due to such factors as the subsidies the government gives to gas, protecting the oil supply in the Persian Gulf, lost time in traffic and the environmental cost.  Estimates of the true cost of a gallon of gas vary between $5 and $15.  At those prices, Cash for Clunkers program was quite a good investment. 

However, whether the Cash for Clunkers program was as efficient at cutting our oil usage and pollution as other approaches such as home energy efficiency improvements, or increased ride sharing, public transit or bike paths remains to be seen.

The rich continue to get richer

Paul Krugman calls out the latest income inequality numbers from Emmanuel Saez.  The nearly thirty year trend of increasing income inequality got noticeably larger during the Clinton & Bush II years.  And yes, that is the % of income claimed by the wealthiest 1/10000th of the US population.  The wealth values are no doubt even higher.  These values only go up to 2007, but my guess is that 2008 was even higher, and possibly 2009 as well.

Saez07 

If we look at just the top 1%, they claim 23% of all income and followed a similar path as the top 1/100%, though not as radical.  The top 1%, by the way, represents families with an annual income above $398,900 in 2007.  Who says we cannot pay for health care and close the deficit by taxing these folks more.

Download the data and graphs in Excel format.  Table 2 has a nice summary.

Spanish Communist town provides jobs and housing

From the Dollars & Sense blog comes this NY Times piece about a Communist run town in Spain providing jobs and housing.  The NY Times focuses far too much time on what the mayor does than on how they put their Communist economy into practice.  Last I knew towns had councils that acted as a municipality's legislature.  My guess is that they are approving the town's municipal housing program and farming cooperative.  Here is the wikipedia entry that lists more about the town council.

The reporter wrote a similar article for the International Herald Tribune that appeared in the Boston Globe a month ago.

The bonuses aren’t the big scandal at AIG

I meant to write this before, but Eliot Spitzer beat me to it.   I agree that we should force the folks who got bonuses at AIG to give them back (Doug Henwood blogs about how to do that), or tax them at 150% percent. 

However, the real scandal is that while millions of people have been laid off, UAW members are forced to renegotiate their contracts, and the US government is bailing out the banking sector seemingly without any upside, AIG paid out tens of billions of dollars to banks, hedge funds and others making good on the poorly setup Credit Default Swap (CDS) contracts that AIG entered into.

As he writes:

It all appears, once again, to be the same insiders protecting
themselves against sharing the pain and risk of their own bad
adventure. The payments to AIG’s counterparties are justified with an
appeal to the sanctity of contract. If AIG’s contracts turned out to be
shaky, the theory goes, then the whole edifice of the financial system
would collapse.

But
wait a moment, aren’t we in the midst of reopening contracts all over
the place to share the burden of this crisis? From raising taxes—income
taxes to sales taxes—to properly reopening labor contracts, we are all
being asked to pitch in and carry our share of the burden. Workers
around the country are being asked to take pay cuts and accept shorter
work weeks so that colleagues won’t be laid off. Why can’t Wall Street
royalty shoulder some of the burden? Why did Goldman have to get back
100 cents on the dollar? Didn’t we already give Goldman a $25 billion
capital infusion, and aren’t they sitting on more than $100 billion in
cash? Haven’t we been told recently that they are beginning to come
back to fiscal stability? If that is so, couldn’t they have accepted a
discount, and couldn’t they have agreed to certain conditions before
the AIG dollars—that is, our dollars—flowed?

The appearance that
this was all an inside job is overwhelming. AIG was nothing more than a
conduit for huge capital flows to the same old suspects, with no reason
or explanation.

The US government owns 80% of AIG, right.  It would have gone bankrupt without our money potentially taking down the economy.  So why don’t we force AIG to renegotiate the CDS contracts it has entered into.  What are the parties on the other end of the CDSs going to do, have us call in the money they have borrowed from us?

Hat tip to Dollars & Sense for citing Spitzer’s article.

And in Iceland

Common Dreams has a great article
by Rebecca Solnit on the situation on Iceland (from TomDispatch).  She
goes into more depth than other articles I have seen and provides some
useful analysis and history.   I liked the characterization of Iceland
as a hedge fund and a country rolled into one. 

There is now a Socialist & Left-Green coalition running the
government.  Everyone seems to be blaise about the fact that the new PM
is an out lesbian, which is most gratifying.  It also looks like the
Left-Green Party *may* come out on top in the April elections, though
we shall see.  Back in October, Doug Henwood interviewed Ögmundur Jónasson, head of the Left Green delegation in the Icelandic parliament on his radio show.  If you don't, you should subscribe to his newsletter, or at least read his blog.

Interesting Economic Tidbits

Dollars & Sense posted some interesting links (many from the Financial Times, it would appear) on their blog including:

  • The double digit annualized GDP falls in Japan and Latvia.  Other parts of Asia don't look very healthy either.
  • The health and economic cost of the increasing obesity epidemic in Mexico (MY NOTE: spurred by all of our subsidies to corn production.)
  • Several analyses of the new financial stabilization plan announced yesterday.  D&S summarized with:
This is simply unbelievable: assets worth virtually nothing because
they consisted of much less than their hyper-excessive leverage
multiples are to be peddled to the very same sort of investors who have
just been burned by these things, simply because the leverage is now to
be put up by uncomplaining (not to mention increasingly skint)
taxpayers and foreign investors, and not the banks. And this in an
attempt to make a transition to a less-leveraged system! It's no
surprise that nobody seems to be buying it.

All together, the
proposals put forward today could amount to nearly $3 trillion. And
everyone except the administration seems to believe that won't be
nearly enough.

You should read the article yourself.

A little on the economic stimulus bill

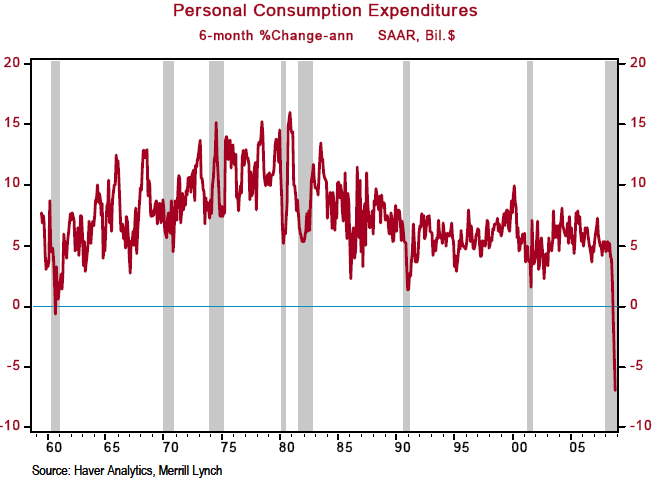
My brief review of the economic stimulus bill is that it will be too little to buoy a US economy that is dropping off of a cliff and is directed at the wrong areas.  There are too many tax cuts, which will end up being saved rather than spent, and too little government spending, especially to state and local governments who will end up cutting tens of thousands if not hundreds of thousands of jobs, further increasing unemployment.

If you doubt that the US economy is dropping off of a cliff, then check out these graphs.  First, from The Big Picture, personal consumption expenditures is falling at a rate not seen in over forty years:


And second this graphic on the change in industrial production now, versus the average of all post war recessions as well as the best case and worst case [from Brad Setser’s Follow the Money Blog].  If this were a “normal” recession, we would be starting to bounce back.  This is not a normal recession.

We’re Big in Japan

Well, it looks like Obama's financial team has its head just as much in the sand as Bush's team, and more importantly, Japan's team from their ten year financial crisis in the 90s.  Tim Duy (by way of Mark Thoma) reports that Obama's plan to deal with financial crisis:

… will be "smaller" than originally expected, said the industry
source, and centered around government guarantees and insurance of troubled
assets …

As the post points out, we tried this with Citigroup and Bank of America, and, at least by the measure of their stock prices, it hasn't worked.

Quick history lesson: 

When Japan's asset bubble burst in 1990, many banks were left insolvent with loans that just weren't going to be paid.  The Japanese government didn't insist that such banks update their balance sheets to reflect the insolvent loans.  On paper the banks were fine, but in reality they were bankrupt.  The end result was that these zombie banks lived on for years, suppressing lending and helping to keep the Japanese economy in a recession for ten years.

Apparently we are repeating Japan's mistakes as Tim Duy says:

Classic. Absolutely classic. Is this really addressing the
problem of pricing? Are we not in the same boat of “if we pay too little, the
bank is undercapitalized, but if we pay too much, the taxpayer holds the bag and
therefore we need to nationalize”? Obviously we are in the same boat, because
the new plan may cause an “accounting problem.” Like insolvency. That is, in
fact, a problem, no argument from me. Apparently, though, the Administration’s
solution is a suspension of accounting rules. Translation – we are going to try
to hide the problem.

The solution, of course, is for federal banking regulators to examine banks that look troubled, and nationalize insolvent banks.  The share holders get scalped, but what did they expect?  Once the feds clean them up, they can then sell them off for a profit when the economy bounces back. 

We did this for many savings and loans in the late 80s, but Obama's economics team seems to be avoiding nationalizing troubled banks (Citygroup, BoA, …).  Instead, the federal government will guarantee or insure the toxic assets on the bank balance sheets.  Heads the banks and their shareholders win, tails the taxpayers lose.

These folks should know they are putting good money after bad, here, but I guess they still believe their precious neoclassical economics more than reality.  Its looking like it will be a really long recession, it not something worse.

NOTE: Dollars & Sense has a partial reprint of a Yves Smith article on the same subject.  Naked Capitalism has the whole article.  Both this one and Tim Duy's are worth the read.